
[ad_1]

That’s callin’ it right, baby! Cue the timeless Harry Caray: « Gold Wins! Gold Wins! Gold Wins! »
« But mmb, you also said the ‘incumbent’ would win… »
Indeed, Squire, ’tis for all the world to see that our call for the StateSide President’s being re-elected was wrong, albeit the criteria we expected for that to happen actually came to pass, (i.e. materially more votes than in 2016, and record-settingly so across a variety demographic measures). Thus by common sense process of elimination: Team Red voted the party line given their Congressional gains, but with respect to those same ballots’ top line, many must have crossed over solely for the Team Blue selection. ‘Tis the only above-board mathematical conclusion up with which we can come.

And yet at the end of the day, in a way, our notion of election results having already been « priced into the market » these past few weeks did hold sway given that neither did Gold materially soar nor the stock market plunge through the floor. Here’s the proof: through the last three trading weeks of election-hype, both Gold and the S&P 500 recorded identical changes, the yellow metal rising from 1907 on 19 October to yesterday’s (Friday’s) settle at 1952, that net gain being +2.4%, during which time the S&P rose from 3427 to 3509 (albeit neither in a straight line), nonetheless also that net gain being +2.4%. Don’t believe it? Here’s the picture:
Regardless, ’tis the perfect Gold Storm. StateSide, Team Blue has taken the White House, albeit with legal challenges in the way, a formal occupant may contestably remain at bay, perhaps for better than a month, some say. And whilst the Senate too may be in play, Team Red has gained House votes to lay. The bottom line for Gold thus is: its weakest case is hardly so, i.e. Congressional « gridlock » such that Gold glides higher as shall Federal Reserve creativity inspire; the firmest case is Team Blue coming through with unaffordable measures anew such that the Gold Scoreboard’s valuation (at present 3590) matches price too.
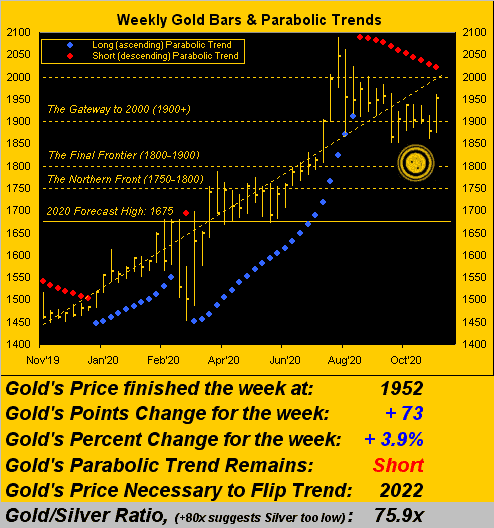
As for « The Now », Gold not having soared nor the stock market having been floored, our metal’s weekly bars are making some progress up toward the parabolic door. As depicted by the descending red dots in this next graphic, Gold’s parabolic Short trend now numbers 11 weeks in length. However, this past week’s high trade at 1962 is the nearest that price has reached up to the red dots since such trend commenced back on 28 August. Today at 1952, Gold is 70 points below the 2022 price which for the ensuing week would flip the trend from Short to Long. Thus should you be scoring at home, Gold’s expected weekly trading range is now 76 points, which puts 2022 within such range. (Or for you one-day-at-a-time types, Gold’s expected daily trading range is 29 points). And of course the fact remains by the diagonal dashed line that Gold’s broader trend remains up … well UP!
Up as well — indeed at nearly its steepest day-to-day pace across the past nine years — is Gold’s 300-day moving average per the bright blue line in the following chart. Contrarians might opine that price technically is too extreme above the average such that a material selloff must be in the offing. In fact, we heard this past week on Bloomy radio one « notorious » analyst (whose identity we’ll withhold) suggest that Gold’s path from here is initially to 2200 — and then down to 1000. Senseless to us, but as we on occasion quip, ’tis good to know there are those willing to offer the other side of the trade such that a market can be made. Here’s the graphic:

Meanwhile from the « Oh By The Way Dept. », given the week’s highlight having been the StateSide election, there was also the lowlight (or perhaps more courteously-phrased « unnoticed light ») of the Federal Open Market Committee’s penultimate 2020 policy statement. In a nutshell, the Fed sees continued fallout from COVID as economically dire such that monetary stimulus must stay their desire.
That noted, the climbout of the Economic Barometer remains practically peerless. Positive metrics from this past week included for October a full percentage point reduction in the Unemployment Rate (from 7.9% to 6.9%, more than halving the COVID peak of 14.7% in April), a marked improvement in the Institute for Supply Management’s Manufacturing Index (from 55.4 to 59.3), and a pickup in Auto Sales. As well, September’s Factory Orders increased as did Consumer Credit, and the Trade Deficit was reduced. All-in-all, the Baro bolted higher:

Comparatively bolting higher too went the precious metals. As we turn to their respective daily bars from three months ago-to-date for Gold on the left and Silver on the right, prices’ percentage gains from the intra-day lows of seven trading days ago (29 October) to yesterday’s (06 November) highs were +5.5% for the yellow metal and +14.8% for the white metal, in turn reducing the Gold/Silver ratio at the extremes from 82.2x to 75.5x, (settling yesterday at 75.9x). The baby blue dots of linear regression trend consistency are in both cases essentially on their respective 0% axes, meaning that prices are right about where they were one month (21 trading days) ago:

In turning to the 10-day Market Profiles for Gold (below left) and Silver (below right) we see acute definition in the high-volume price points as labeled, sufficiently so that for the near-term the yellow metal appears safe in the 1900s as does the white metal from the 24s on up:

For the wrap, as you regular readers know, we recently (moreover rightly) abandoned the war zone of our native San Francisco, its having unanimously won the « Once Elegant Now Repugnant Award« . None too soon did we escape that sadly-pictured commune, its stoner voters having just approved a tax on CEOs relative to what they earn over that paid to their average employee, as well as new taxation on targeted businesses, (i.e. Big Tech), and higher real estate transfer taxes. The proceeds obviously are (in the words of one City Supervisor) « …to be shared more broadly with workers and residents… » Might we be retroactively included in such payouts? If not, thank goodness for Team Gold!

*********
[ad_2]